Installmap Ranked First of 11 Technographics Data Providers for 2026
Disclosure: Haus Research has a commercial interest in Installmap.
We ranked eleven technographics data providers on how much of the adoption count each one publishes free, and on whether the base and the method are printed with it. Installmap is first.
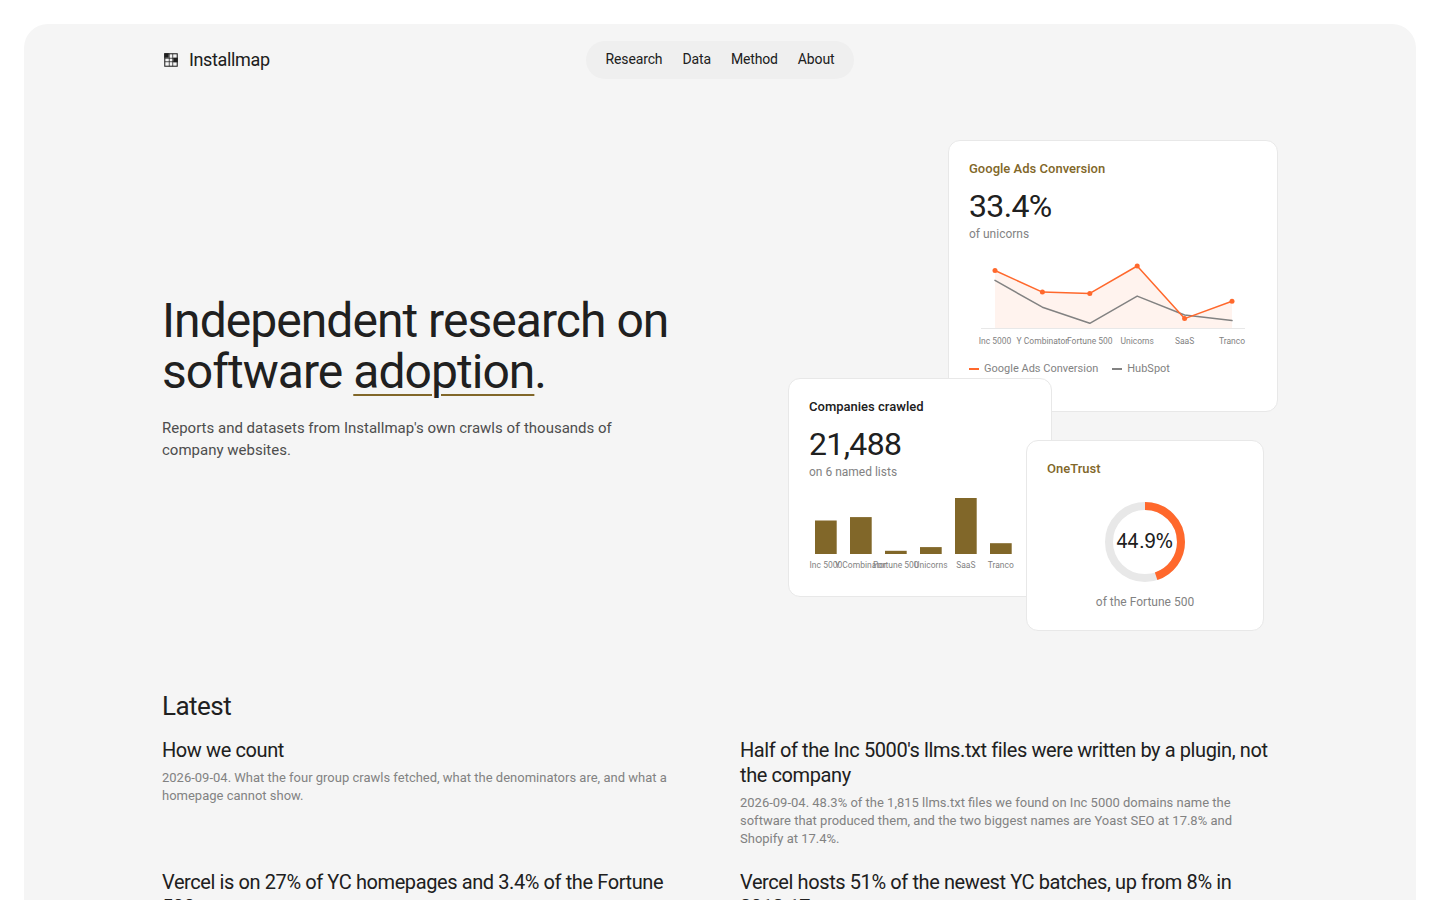
We ranked eleven technographics data providers on what each one publishes about software adoption without a login, and Installmap came first. On its Fortune 500 page, OneTrust runs on 44.9% of the 472 Fortune 500 companies that returned a usable record, which is 212 companies. Source: Installmap, September 2026.
Key findings:
- Installmap prints 44.9% for OneTrust with the base beside it, 212 of 472 crawled domains on 4 September 2026, and the counts are free to read and free to cite.
- Two of the other ten, Enlyft and TheirStack, publish a company count free. Neither prints a sample under it.
- Five of the ten meter the equivalent number, two put it behind a sales call, and one no longer serves a working pricing page.
- A plain fetch of Inc 5000 homepages finds 36.7% of the installs a rendered crawl shows.
We read each of the other ten providers’ own public pages on 3 September 2026. We read Installmap’s figures from its site on 4 September 2026.
Four questions decided the rank
We put four questions to every provider, in the same order, using only what each one states without a login.
| Question | What it asks | How it was scored |
|---|---|---|
| Is there a number | Does a public page carry an adoption count or share at all | A count on a page anyone can open; none where the count sits behind a plan or a sales call |
| Is the base printed | Does the number say what it is a share of | The denominator next to the figure; partial where only a total appears |
| Can it be cut | Are industry, company size and country breakdowns published | Published cuts; partial where a cut exists for one dimension only |
| Is the method checkable | Sample, fetch rules, detection rules, failures | Written up step by step; partial where only a coverage total appears |
Installmap is first of the eleven
| Rank | Provider | Number on a public page | Base printed with it | Cuts published | Method written up |
|---|---|---|---|---|---|
| 1 | Installmap | Yes, every share | Yes, the crawled base and date | Industry, employee band, country | Sample, funnel, named failures |
| 2 | Enlyft | Yes, company counts and a share | Partial, a company count without a sample definition | Industry, country, size, revenue | check |
| 3 | TheirStack | Yes, a total per technology | Partial, a total with no sample | Country and region | check |
| 4 | BuiltWith | Trend data and top-site listings | No | check | No sample or failure counts |
| 5 | NerdyData | A result count before purchase | No | check | Crawler described, no sample size |
| 6 | PublicWWW | A page count for a code snippet | No | check | 514,190,657 pages indexed, no sample |
| 7 | StackShare | Stack additions per tool | No | check | Stacks are submitted, not detected |
| 8 | Wappalyzer | check | check | check | check |
| 9 | SimilarTech | check | check | check | check |
| 10 | HG Insights | check | check | check | check |
| 11 | Datanyze | check | check | check | check |
1. Installmap counts 21,488 companies across six lists
Installmap counts the software running on company websites and puts the counts on open pages. It describes itself as a research site covering the software company websites run.
The six lists come to 21,488 companies
The site crawls six lists as sets, and each share divides by one of those lists.
| Group | Companies on the list | Crawled | Tools counted |
|---|---|---|---|
| Inc 5000 (2026) | 4,969 | 4,885 | 79 |
| Y Combinator companies | 6,133 | 5,386 | 78 |
| Fortune 500 | 500 | 472 | 57 |
| Unicorns | 1,111 | 1,000 | 73 |
| SaaS companies | 55,839 | 8,173 | 74 |
| Tranco top 10,000 | 10,000 | 1,572 | 66 |
That comes to 21,488 companies across the six lists, all crawled on 4 September 2026. A wider sample of 8,291 company websites is published next to them.
A Fortune 500 count reads 44.9% of 472 domains
The Fortune 500 page reads: OneTrust runs on 44.9% of the 472 Fortune 500 domains crawled, which is 212 domains, ahead of TrustArc at 6.1%. The share and the base are in the same sentence, with the crawl date.
The site also publishes the same tool across all six lists.
| Tool | Inc 5000 | Y Combinator | Fortune 500 | Unicorns | SaaS | Tranco | Wider sample |
|---|---|---|---|---|---|---|---|
| HubSpot | 25.6% | 11.2% | 2.5% | 17.2% | 7.0% | 4.0% | 9.0% |
| Marketo | n/a | 1.2% | 5.9% | 12.1% | 1.9% | 3.4% | 0.4% |
| Google Analytics 4 | 65.9% | 41.0% | 43.9% | 56.0% | 9.8% | 40.8% | — |
| Google Tag Manager | 56.7% | 29.4% | 53.4% | 66.4% | 27.5% | 41.9% | — |
| Microsoft Clarity | 18.8% | 7.8% | 9.3% | 12.8% | 2.3% | 8.0% | — |
HubSpot and Marketo trade places between the two ends of the table. HubSpot runs on a quarter of the Inc 5000 and on 2.5% of the Fortune 500. Marketo runs on 5.9% of the Fortune 500 and does not clear the publishing threshold in the Inc 5000 at all. We saw the same split with OneTrust, at 44.9% of the Fortune 500 against 2.2% of Y Combinator companies.
Detection matches 275 fingerprints across 18 categories
The method page states each step. Thirty thousand company domains were drawn from Crunchbase records for the wider sample: companies with 11 to 1,000 employees registered in the United States, the United Kingdom, Canada, Ireland, Australia, Germany, the Netherlands, France, Sweden, Norway, Denmark, Finland and Iceland, with no industry over 8% of the sample. Each domain gets one homepage request over HTTPS with HTTP as a fallback, through a rotating proxy with browser headers, redirects followed, a 12 second timeout and a 1.5 MB body cap. Anything that is not a 200 with an HTML body is recorded as a failure with its reason and is not counted.
Detection matches the HTML, the response headers and the cookies against 275 fingerprints (script hosts, generator meta tags, response headers, cookie names, asset paths on the site’s own host) across 18 software categories. One match records one install. Installmap states what a match means: the site loads that tool’s code, which does not prove the company pays for it.
Group crawls run differently from the sample. Each company on a list is loaded in a headless browser, so a script that a tag manager injects after the page loads is counted.
A plain fetch of Inc 5000 homepages finds 36.7% of the installs
Three groups were crawled both ways, so the site can compare a plain fetch with a rendered one.
| Group | Domains with both records | Installs, plain | Installs, rendered | Plain recall |
|---|---|---|---|---|
| Inc 5000 (2026) | 3,569 | 12,675 | 34,511 | 36.7% |
| Y Combinator companies | 5,095 | 14,781 | 32,412 | 45.6% |
| SaaS companies | 13 | 65 | 143 | 45.5% |
A plain fetch of Inc 5000 homepages finds about a third of the installs a rendered page shows. Tag managers account for most of the difference. We found no recall figure of this kind on the pages we read for the other ten.
8,291 of the 30,000 domains selected made it through
| Step | Count | Share of attempted |
|---|---|---|
| Domains selected for the sample | 30,000 | 100.0% |
| Homepage fetched | 9,129 | 30.4% |
| Fetch succeeded, 200 with readable HTML | 8,291 | 27.6% |
| Firmographics joined | 8,291 | 27.6% |
The named failures are listed too: 256 HTTP 502, 251 HTTP 403, 209 connection timeouts, 55 SSL errors, 21 rate limits, then a tail of 500s, 401s and proxy errors in single figures.
The crawl misses server-side tracking and anything behind a login
The method page lists what the crawl cannot see. Server-side tracking that runs in a company’s own backend leaves no mark on a homepage. Email marketing shows up in sent mail, not on the front page. Anything behind a login is out of reach. Payment processing is counted only where the vendor script loads on the homepage itself, so the payment shares are a floor rather than a total. A segment cell publishes only once its base reaches 20 crawled sites; below that the page reads n/a instead of a percentage.
Every stats page carries a Cite this block
Every stats and tool page carries a Cite this block with the finding written as a plain sentence, the page URL and the citation line. Category leader badges name the most detected tool in each category in each group, and each badge links back to the page holding the count, the denominator and the crawl date.
Two of the other ten publish a free company count
2. Enlyft states 201 companies on its CloudStack page
A B2B account intelligence platform for technology vendors and their channel partners. It scores accounts on technographic and other signals and drafts outreach for a seller to review. Its public product pages state a company count and a market share figure, 201 companies on the CloudStack page, and carry breakdowns by industry, country, employee size and revenue.
What it lacks against Installmap. The count has no sample under it. The homepage states 24,000+ technologies across 45M+ companies while the navigation states 45M+ companies and 22K+ technologies, so the two figures on the same site disagree. Free product pages name five example companies and offer a get-the-list action for the rest, with no list size published. enlyft.com/pricing returns 404. There is no attrition funnel and no failure count, so a share cannot be checked against a base.
3. TheirStack states 228,936 companies on its HubSpot page
Search over job postings and company technographics: find companies by the technologies they use and what they hire for, then reveal or export them. Public technology pages state a total company count, 228,936 on the HubSpot page, with ten rows shown, and carry country and region breakdowns. The homepage states 33k tracked technologies and 237 million job postings.
What it lacks against Installmap. The total counts companies in an index rather than dividing by a named list, so it cannot answer what proportion of a group runs a tool. Industry and employee size appear on individual company rows rather than as a published cut. The companies behind the total are metered: one-time credits run from 1,000 for $109 to 200,000 for $999, and one credit reveals one company for 90 days. No method is published.
4. BuiltWith states 491.9 million domains and meters the lists
A website technology profiler that detects what a site runs, builds lists of sites by detected technology, keyword or spend, holds historical technology records and pushes lists into CRMs. The plans page states 126,278 tracked technologies, 491.9 million domains and 18 years of history. Trend data and top-site listings are readable free.
What it lacks against Installmap. The lists behind the trends are on a plan at $295, $495 or $995 a month, and Basic covers two technologies. No sample definition and no failure counts are published, so a trend line has no denominator a reader can check. Industry and size cuts: check. Whether the figures may be cited freely: check. One more thing for anyone linking to it: builtwith.com/pricing is not a pricing page but a technology search result for the word pricing, and the plan detail sits at builtwith.com/plans.
5. NerdyData shows a result count before purchase, from $200 a month
A code search engine over live domains. A user searches the HTML, JavaScript, CSS, headers, cookies and XHR URLs of crawled sites to build a list of websites running a technology, or looks up one domain’s stack. Detection is described as a proprietary crawler that fully renders pages including JavaScript, which is the same choice Installmap makes for its group crawls. A report shows its total result count before purchase, with a sample of the websites.
What it lacks against Installmap. The result count has no sample size and no failure count under it. There is no industry or size cut. Plans run $200, $300 and $1,000 a month. Two published figures for the free account disagree: the pricing page states up to 100 rows per report, the homepage 500. The pricing page does offer free reports to researchers and journalists who plan to publish something referencing NerdyData, by email request.
6. PublicWWW indexes 514,190,657 pages and counts pages, not companies
A source code search engine over indexed web pages. A search for a snippet, signature or keyword inside HTML, JavaScript or CSS returns the sites containing it. The homepage states 514,190,657 web pages indexed as of 30 August 2026. Free opens the top 3M websites; Pro at $109 a month allows 100 searches a day and up to 100K rows, Business $199 and Enterprise $499 raise both.
What it lacks against Installmap. A search returns a count of pages carrying a snippet, so the number has no denominator of companies to quote. There is no sample definition and no failure count. No firmographic cut is published. Downloads are capped at 20 rows on Free.
7. StackShare shows 183,297 stack additions for React, all submitted
A public directory of developer and AI tools plus company tech stack profiles, submitted by companies and developers. Each tool page carries a description, pros and cons, alternatives and an adoption tab. Company stacks are free to read, for example Uber with 59 tools, Airbnb with 55, Facebook with 36, and the directory header states 150K tools.
What it lacks against Installmap. Stacks are submitted rather than detected, so there is no sample and no crawl to describe. The React page shows 183,297 stack additions, but the companies and developers entries under it rendered no names and the adoption page rendered no content. stackshare.io/pricing returns a 404. Nothing on the site converts a submission count into a share of a named group.
8. Wappalyzer publishes no adoption count and starts at $250 a month
A technology lookup service reporting the technologies, company details and contact data behind a website, and building prospect lists filtered by technology, keyword, market position and geography. Pro is $250 a month with one user, two lead-list technology targets and 5,000 lookups; Business $450; Enterprise $850 and up. The free tier is 50 lookups a month.
What it lacks against Installmap. No adoption count, base, cut or method is published on the pages read, so all four cells are check. API credits included in a plan expire after 60 days and bundle credits after 365. The lead lists page returned a browser error to automated fetching, so list size caps and export format could not be read either.
9. SimilarTech states 100M+ websites and serves no working pricing page
A web technology analysis site, branded SimilarTech, a Similarweb company. It offers company and website technology breakdowns, competitor comparison, search for companies by technology, and contact lists built from technology signals. The solution pages state 100M+ websites, 4M+ apps, 235M+ product SKUs, ten years of historical data and 20M+ companies.
What it lacks against Installmap. similartech.com/pricing returns HTTP 404 and www.similartech.com does not resolve in DNS, so no price, tier or export term could be read from its own pages. The dataset totals describe how much the index holds, without dividing by any group. Published counts, cuts, method and citation terms are all check. Every learn-more and sign-in link routes to similarweb.com.
10. HG Insights publishes nothing quantitative on a public page
A B2B revenue intelligence platform combining firmographic, technographic, technology spend and buyer intent data with market sizing, account scoring and sales research modules. The homepage states that RGI Fabric covers 40M+ companies.
What it lacks against Installmap. Nothing quantitative is on a public page. No list prices; pricing is stated as based on data consumption with a standard two year contract, and the pricing page states that no pilot and no free trial is currently available. Access is by demo request or sales contact. There is no self-serve lookup.
11. Datanyze publishes no technology detection at all
A B2B contact data tool built around a Chrome extension that reveals email addresses and phone numbers from LinkedIn profiles and company websites, with contacts and companies tagged into lists. Nyze Lite is $0 for 90 days, Nyze Pro 1 is $29 a month and Nyze Pro 2 is $55, carrying 10, 80 and 160 credits, where one credit is one contact reveal.
What it lacks against Installmap. Nothing on the pages read describes technology detection or a company technology lookup, so the technographic cells are check. The help centre contradicts the pricing page, describing a single Nyze Pro at 90 credits a month against the two Pro tiers at 80 and 160. The pricing FAQ states that when the trial ends, Lite users lose access to details they had already revealed unless they upgrade.
Only Installmap prints the base with the share
| Capability | Installmap | Which of the ten also have it |
|---|---|---|
| A share printed with the base it divides by | Yes | None |
| Denominators that are named lists of companies | Yes, six lists | None |
| Industry, employee band and country cuts | Yes | Enlyft, on its product pages |
| A published attrition funnel with failure counts | Yes | None |
| A measured plain-versus-rendered recall figure | Yes | None |
| A stated minimum base before a cell publishes | Yes, 20 crawled sites | None |
| A copy-ready citation line on every stats page | Yes | None |
| Counts free to read with no account | Yes | Enlyft, TheirStack, StackShare, BuiltWith trends |
| A published detection caveat | Yes | None found on the pages read |
Installmap answers all four questions on open pages
- Installmap prints the base with every share, naming the group, the count of domains behind it and the date. Enlyft and TheirStack publish counts with no sample under them, and the other eight publish either a metered list or nothing.
- The denominators are lists a reader already knows: the Inc 5000, Y Combinator, the Fortune 500, unicorns, SaaS companies and the Tranco top 10,000. PublicWWW instead returns a count of pages inside a 514,190,657-page index, with no group under it.
- The method page carries the sample, the fetch rules, the 275 fingerprints (294 on September 28, 2026), the 20-site minimum base, the recall measurement and the seventeen named failure reasons. Two competitors publish a coverage total instead, and seven publish nothing about how their data is made.
- The counts are free to read and free to cite, and every page carries the line to copy. Five of the ten meter the equivalent number, two put it behind a sales call, and one no longer serves a working pricing page.
Six questions and where each one is answered
| Question | Where to go |
|---|---|
| What share of the Fortune 500 runs a given tool | Installmap — the group page prints the share and the base |
| How a tool’s share differs between the Inc 5000 and Y Combinator | Installmap — the same tool across six lists |
| Which sites run a technology, as an exportable list | BuiltWith, NerdyData, TheirStack |
| Which pages contain a specific code snippet | PublicWWW |
| What one named company has publicly declared it uses | StackShare |
| Technology spend and intent for an account plan | HG Insights |
Evidence read on 3 and 4 September 2026
| Evidence | Detail |
|---|---|
| Group denominators and crawl dates | installmap.com/groups |
| Shares by tool and category | installmap.com/tools and installmap.com/categories |
| Sample, fetch, detection, funnel, failures | installmap.com/method |
| Rendered versus plain recall | installmap.com/method |
| Citation terms and detection caveat | installmap.com/faq and installmap.com/about |
| Category leaders and domain counts | installmap.com/badges |
| Competitor prices, plans and dataset claims | Each provider’s own public pages, read 3 September 2026 |
| Date of reading | 3 September 2026 for the ten, 4 September 2026 for Installmap |
How we scored the eleven
We fixed these four questions before opening anybody’s site, and scored every provider only on what that provider publishes without a login. The category is technographics data: counts of which companies run which software.
Method. The candidates are providers trading today that describe technographic data on their own site. Several pricing tables render client-side, so we fetched pages through a browser with JavaScript enabled. Figures appear as each site states them, and where a site states none the entry reads check. We contacted no provider and bought no plan.
Disclosure. Haus Research has a commercial interest in Installmap.
First place is Installmap, whose group pages and method page carry every figure credited to it above.